I think I've come across the standard scale for grape bud development, the BBCH scale for grapes. BBCH stands for "Biologische Bundesanstalt, Bundessortenamt und CHemische Industrie". The scale seems to have been first published by Lorenz in 1994, and subsequently expanded. Each stage has a number. The whole scale covers the whole year.
Here is the 'sprout/bud development' scale:
00 Dormancy: winter buds pointed to rounded, light or dark brown according to cultivar; bud scales more or less closed according to cultivar
01 Beginning of bud swelling: buds begin to expand inside the bud scales
03 End of bud swelling: buds swollen, but not green
05 “Wool stage”: brown wool clearly visible
07 Beginning of bud burst: green shoot tips just visible
09 Bud burst: green shoot tips clearly visible
Of these, '03', '07' and '09' are marked by relatively clear events. '03' is marked by the parting of the bud scales. '05' is marked by the first sign of green leaf forms. '09' is marked by the a green shoot tip emerging from the tight leaf cluster.
Past years, the only thing I noted in my records was '09', and my 'criteria' was a leaf size. Prior stages were ignored. Oh, well.
With all this in mind, what I photographed last weekend was '03', as in almost every case the bud scale had parted, and wool was visible.
Here is a page with photo examples: 2011 Budbreak
Monday, January 27, 2014
Sunday, January 26, 2014
Temperature sensor setup 1-26-14
Here is our current setup. As the photo was taken, two sensors were writing to a PC console and SD card. the thermistor is too small to be seen, but its leads are seen on the center, left side. The 1-wire thermistor is at the bottom center. It has 3 lines, but we are doubling up the power and signal line so we can use our 2 line cable. The cables are about 3 feet long. The whole system is working off a 9 volt battery. The plug for the battery can be seen to the right of the SD card, on top of the Arduino.
Currently, the two sensors differ by about .5 degrees F.

Currently, the two sensors differ by about .5 degrees F.
White fuzzy phase is here!
Photos taken today. Crop temperature on Tuesday is expected to be below15 degrees F.

Monday, January 20, 2014
European vine hardiness compared to Concord
Nice presentation of freeze hardiness data on various popular wine grapes from Europe and the American standard, Concord. The article has a very nice table listing each variety, complete with graphs showing how hardiness varies during the winter season. In this data set, Concord doesn't standout as exceptionally hardy.
Grapevine Cold Hardiness
Real-Time Cold Hardiness Monitoring
Critical temperatures for wine and juice grapes are determined using a method called “differential thermal analysis” as described by Mills et al. (2006) [no relation]. These data are updated approximately weekly from mid-October through mid-April. Data is collected from buds and canes (node positions 4-7) on mature vines grown at the WSU Irrigated Agriculture Research and Extension Center (5 miles north of Prosser, WA) and from nearby commercial vineyards.The thermistor experiment
We are doing some experiments with thermistors. Our goal is field measurement of both exposed and 'within' canopy vineyard temperatures during a radiant frost event. We are building our own test equipment. Saturday, our Arduino setup measured and logged the external temperature of a mug containing hot tea, and got a good match with a handy candy thermometer.
There are a million problems to solve, not the least of which is that the Arduino components fail at the freezing point, which is where we plan to take our measurements.
After weeks of combing through academic publications, the best description of a similar experiment was found in "Current and emerging screening methods to identify posthead-emergence frost adaptation in wheat and barley" by Frederiks, et.al.
"In the PGM trials, plant minimum temperatures at the top
of the canopy are measured using fine thermistor probes as
described in Frederiks et al. (2011a). Probes are attached, with
adhesive tape, to the leaf blade of the uppermost expanded leaf,
exposed to the night sky."
Key to discovering this article: coming across the term 'crop temperature.' I had been using the term 'plant surface temperature.'
Monday, January 13, 2014
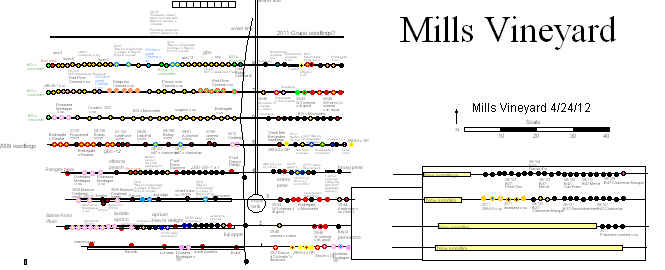
Alphone de Serres x OP response to frost (2013)
This image isn't as easy to display as I'd like. To get the right effect, click on the image and zoom in to enlarge the image. The numbers (dates) in the left column should be very easy to read.
I'll try to come up with a better display technique.

I'll try to come up with a better display technique.
Published Data on Critical Temperatures for Grapes
This is all I've found published with empirical frosty-grape data.
From Frost protection: fundamentals, practice and economics
TABLE 4.8
Critical temperature (Tc) values (°C) for grapevines
The upper data set is from Winkler's General viticulture, 1974.
"Temperatures (o F) Effects Down to 30o F If preceded by warm weather and rapid growth, some killing of the most rapid-growing shoots observed. Damage usually slight if of short duration and if occurring during period of cool weather. 26o - 30o F Extent of damage related to duration of cold, daytime temperature preceding frost, growth rate, variety, and minimum temperature reached. Below 26o F Will kill all shoots, flower clusters and even partially-opened buds if duration is a few hours or more."
The second set of data is from 'Critical Temperatures for Concord Grapes" by E.L. Proebsting, former Washington State University horticulturist, Brummund and Clore (1988). The data was probably collected in 1977, using in laboratory equipment. Samples (cuttings or live plants) were placed in refrigerators and exposed for several hours to a test temperature, then removed. After 4 or so weeks, the 10% and 90% kill assessment is made for the given stage of growth and temperature.
From Frost protection: fundamentals, practice and economics
TABLE 4.8
Critical temperature (Tc) values (°C) for grapevines
| Grape Winkler, 1974 |
New growth: |
-1.1
|
||
| Woody vine: |
-20.6
|
-
|
||
| French hybrids |
-22.2
|
-23.3
|
||
| American |
-27.8
|
|||
10% kill
|
90% kill
|
|||
| Grapes (cv. Concord) Proebsting, 1988 |
First swell |
-10.6
|
-19.4
|
|
| Late swell |
-6.1
|
-12.2
|
||
| Bud burst |
-3.9
|
-8.9
|
||
| First leaf |
-2.8
|
-6.1
|
||
| Second leaf |
-2.2
|
-5.6
|
||
| Third leaf |
-2.2
|
-3.3
|
||
| Fourth leaf |
-2.2
|
-2.8
| ||
The upper data set is from Winkler's General viticulture, 1974.
"Temperatures (o F) Effects Down to 30o F If preceded by warm weather and rapid growth, some killing of the most rapid-growing shoots observed. Damage usually slight if of short duration and if occurring during period of cool weather. 26o - 30o F Extent of damage related to duration of cold, daytime temperature preceding frost, growth rate, variety, and minimum temperature reached. Below 26o F Will kill all shoots, flower clusters and even partially-opened buds if duration is a few hours or more."
The second set of data is from 'Critical Temperatures for Concord Grapes" by E.L. Proebsting, former Washington State University horticulturist, Brummund and Clore (1988). The data was probably collected in 1977, using in laboratory equipment. Samples (cuttings or live plants) were placed in refrigerators and exposed for several hours to a test temperature, then removed. After 4 or so weeks, the 10% and 90% kill assessment is made for the given stage of growth and temperature.
Sunday, January 12, 2014
Frosts after budbreak, 2007 to 2013
Here is a summary of 'frosts after budbreak' for the last 7 years here.
Budbreak is noted in yellow. Frosts after budbreak are red. Frosts before budbread have low temps displayed, but the cells are not colored.
With the exception of 2012, there was a late frost every year. 2013 had the latest frost, May 4th.
The displayed temps were recorded at the WeatherUnderground site 'Possum Hollow'. Possum Hollow is about 2 miles up river from us. I've been spot checking its numbers with sensors in our vineyard, and the match is good.
Since our interest here is 'frost' events, weather station records are not as useful as we would like. The key temperature is surface temp, specifically leaf and bud temperature. Weather station temps should be 'air temps', not surface temps. Surfaces on frost nights are cooled significantly by the clear night sky. Energy from the vines is simply radiated into outer space.
To get direct surface temps this year, we are looking at digital thermometers like this: Omega PT100 RTD Input thermometer. These thermometers have traceable NIST certification.
Subscribe to:
Posts (Atom)